Difference between revisions of "Smart Home"
Jump to navigation
Jump to search
| Line 1: | Line 1: | ||
[[File:SmartHomeMenu.png|right|frame|Smart Home]] | [[File:SmartHomeMenu.png|right|frame|Smart Home]] | ||
<h3 style="display: inline-block; background:#ffffff; font-weight:bold; border-bottom:2px solid #6093cc; text-align:left; color:#000; padding:0.2em 0.4em;"><br />Smart Home</h3> | <h3 style="display: inline-block; background:#ffffff; font-weight:bold; border-bottom:2px solid #6093cc; text-align:left; color:#000; padding:0.2em 0.4em;"><br />Smart Home</h3> | ||
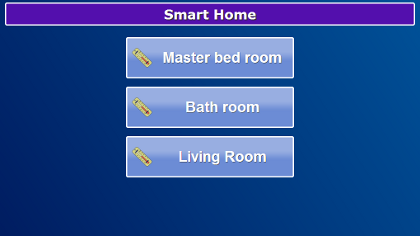
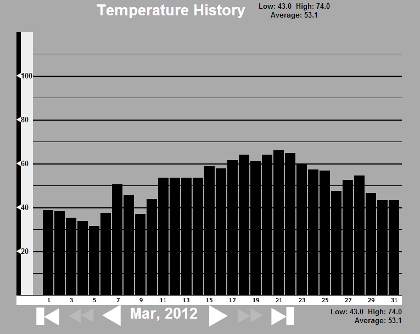
If you use temperature sensors, you can display a history of their temperature readings. Press the Smart Home button on your Main Menu. Then select a sensor by pressing it. A graph will display, showing the average daily temperature recorded by the sensor. The current month displays at first, but you can use the arrows at the bottom of the graph to display the graphs for other months.<br /><br /> | If you use temperature sensors, you can display a history of their temperature readings. Press the Smart Home button on your Main Menu. Then select a sensor by pressing it. A graph will display, showing the average daily temperature recorded by the sensor. The current month displays at first, but you can use the arrows at the bottom of the graph to display the graphs for other months.<br /><br /> | ||
[[File:TemperatureHistory.png|none|Temperature]] | |||
Revision as of 21:51, 10 October 2012

Smart Home
Smart Home
If you use temperature sensors, you can display a history of their temperature readings. Press the Smart Home button on your Main Menu. Then select a sensor by pressing it. A graph will display, showing the average daily temperature recorded by the sensor. The current month displays at first, but you can use the arrows at the bottom of the graph to display the graphs for other months.
